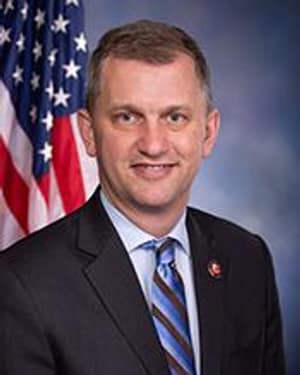
U.S. House · IL-06
Rep. Sean Casten (D)
Represents Illinois’s 6th District, in office since Jan. 3, 2025. Official site (opens in a new tab)
Issue groups for and against Casten
Money from the groups on our issue pages: what they gave, bundled or spent for and against Casten.
All issue money 10 rows
| Issue | Groups | Given | Bundled | Spent for | Spent against |
|---|---|---|---|---|---|
| HousingReal estate and home building | Realtors PAC (RPAC), NMHC PAC | $30,000 | $0 | $12,087 | $0 |
| HousingLabor and tenant-side | SEIU COPE | $2,500 | $0 | $0 | $0 |
| Health care costsHospitals, doctors and drugmakers | AHA PAC, AMPAC | $6,000 | $0 | $0 | $0 |
| Health care costsNurses, workers and patients | SEIU COPE | $2,500 | $0 | $0 | $0 |
| AI & data centersAI and tech company PACs | Google NetPAC, Amazon PAC | $3,500 | $0 | $0 | $0 |
| Energy & climateEnvironmental groups | LCV Action Fund, Sierra Club Independent Action | $1,050 | $0 | $10 | $0 |
| Energy & climateClean energy industry | CleanPower PAC | $5,000 | $0 | $0 | $0 |
| IsraelGroups seeking policy changes | J Street PAC | $30,160 | $0 | $0 | $0 |
| EducationTeachers unions | NEA Fund, AFT COPE | $9,000 | $0 | $0 | $0 |
| DefenseDefense contractors | RTX PAC, Northrop Grumman PAC, Boeing PAC | $11,000 | $0 | $0 | $0 |
Campaign dollars per vote
The 2024 campaign’s spending divided by all votes cast in that general election.
$6.86per vote cast, 2024 · ranks 162 of 422 House members
- This race$6.86
- Opponent$0.41
- IL average$7.05
- House average$8.13
2024 race Votes and campaign spending
| Candidate | Votes | Campaign spent | Per vote cast |
|---|---|---|---|
| Sean Casten (D), won | 196,647 (54.2%) | $2,488,899 (opens in a new tab) | $6.86 |
| Niki Conforti (R) | 166,116 (45.8%) | $150,507 (opens in a new tab) | $0.41 |
Total votes cast: 362,849. “Per vote cast” is the campaign’s total spending for that election divided by all votes cast in the race.


Results: MIT Election Data + Science Lab. Spending: FEC candidate totals for the 2024 election (as of Nov. 21, 2026). How this is calculated.