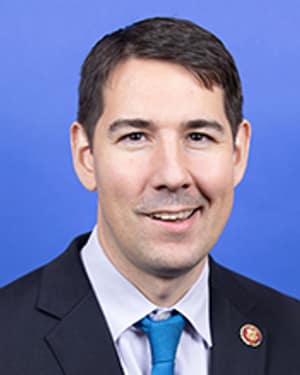
U.S. House · CA-09
Rep. Josh Harder (D)
Represents California’s 9th District, in office since Jan. 3, 2025. Official site (opens in a new tab)
Harder won reelection in CA-09. Outside groups spent $605 on the general election, and $0 of it was on Harder’s side.
Who paid for each side in 2026
FEC filings through Nov. 19, 2026; race call from civicAPI.
LostJohn McBride (R)$605 on their side
WonJosh Harder (D)$0 on their side
Issue groups for and against Harder
Money from the groups on our issue pages: what they gave, bundled or spent for and against Harder.
All issue money 9 rows
| Issue | Groups | Given | Bundled | Spent for | Spent against |
|---|---|---|---|---|---|
| HousingReal estate and home building | Realtors PAC (RPAC), NAHB BUILD-PAC, NMHC PAC | $17,500 | $0 | $0 | $0 |
| Health care costsHospitals, doctors and drugmakers | AHA PAC, AMPAC | $5,500 | $0 | $0 | $0 |
| AbortionAbortion rights | Planned Parenthood Federal PAC, Reproductive Freedom for All PAC | $4,500 | $0 | $0 | $0 |
| Energy & climateEnvironmental groups | LCV Action Fund, Sierra Club Independent Action | $2,050 | $0 | $10 | $0 |
| Energy & climateClean energy industry | CleanPower PAC | $1,000 | $0 | $0 | $0 |
| IsraelAIPAC and allied groups | AIPAC PAC | $4,993 | $27,254 | $0 | $0 |
| IsraelGroups seeking policy changes | J Street PAC | $45,988 | $0 | $0 | $0 |
| EducationTeachers unions | NEA Fund, AFT COPE | $20,000 | $0 | $0 | $0 |
| DefenseArms control | Council for a Livable World | $500 | $1,000 | $0 | $0 |
Campaign dollars per vote
The 2024 campaign’s spending divided by all votes cast in that general election.
- This race$18.80
- Opponent$8.97
- CA average$10.54
- House average$8.13
2024 race Votes and campaign spending
| Candidate | Votes | Campaign spent | Per vote cast |
|---|---|---|---|
| Josh Harder (D), won | 130,183 (51.8%) | $4,726,660 (opens in a new tab) | $18.80 |
| Kevin Lincoln (R) | 121,174 (48.2%) | $2,254,794 (opens in a new tab) | $8.97 |
Total votes cast: 251,357. “Per vote cast” is the campaign’s total spending for that election divided by all votes cast in the race.
Results: MIT Election Data + Science Lab. Spending: FEC candidate totals for the 2024 election (as of Nov. 21, 2026). How this is calculated.